Introduction
With all the excitement about chatGPT I started wondering how Druid can be used to help with training machine learning models. A typical model requires exploratory data analytics to identify features that can contribute, quick access to large amounts of data for training the model and real time monitoring of inputs and outputs from a model. Starting with this post I will be putting together a series of posts on the role Apache Druid can play in the model pipeline. In this first post I will go over some of the capabilities of Druid and how they help with ML models. I will then layout an example of training a regression model using druid as a source.
Where does Druid fit?
Exploratory Data Analytics
Exploratory analytics refers to understanding the different dimensions and metrics and how they behave in relation to the attribute that is being predicted. Some examples of the kind of analytics that are required
- Identify number of rows with null values in categorical attributes and drop null values from training data
- Most ML models do not deal well with null values in categorical variables
- This is a filter operation – very fast in Druid. Druid uses bitmap indexes and hence filter operations are blazingly fast
- Look at row counts for different categorical variables
- Helps in identifying skew
- This is an aggregation – very fast in Druid. Druid uses a shared nothing architecture, pre-fetching of data and partitioning to make aggregations very fast.
- Compute mean, standard deviation and variance for numeric values
- Identify outliers when training regression models to predict numeric data
- Eliminate skewed data that could affect training output
- Statistics on petabytes of data – very fast in Druid
- Aggregate at different time granularities
- Eliminate noisy data when using forecasting models
- Time series queries – very fast in Druid. Data in druid is partitioned by time as the primary dimension
- Look at time variation of metrics with different dimensions
- Identify closely correlated variables and remove them from the training dataset
- Time series queries – very fast in Druid
Model training
Model training requires one or more of below capabilities
- Extract different data points from multiple time intervals to capture patterns in the data.
- Train models on data with different granularities and compare accuracy
- Extract specific patterns from data and check prediction accuracy
- Extract 1000s of data points to train genetic algorithm.
- All the above with many data scientists concurrently querying the data lake and executing queries.
With Druid one can easily extract data at different granularities and from different time periods. Druid is one of the best databases for handling high concurrency workloads.
Monitoring models
While there are many specialised tools to both server and monitor models, Druid is very useful in monitoring the input and output of models. Monitoring requires anomaly detection. To do this one most look back in time and detect patterns, compute statistics and real time and historical data and do all this in under 1 sec.
Training a regression model
Setting up everything
In this section I will train a simple regression model using data in Druid. I am using the gas array temperature modulation dataset (
Burgués, Javier, Juan Manuel Jiménez-Soto, and Santiago Marco. ‘Estimation of the limit of detection in semiconductor gas sensors through linearized calibration models.’ Analytica chimica acta 1013 (2018): 13-25
Burgués, Javier, and Santiago Marco. ‘Multivariate estimation of the limit of detection by orthogonal partial least squares in temperature-modulated MOX sensors.’ Analytica chimica acta 1019 (2018): 49-64.). This dataset contains measurements of CO concentration from a series of experiments. The regression model is to be trained to predict the CO concentration using the measurements from various sensors. Download the dataset and unzip it. You will get separate csv files from 2016/09/30 to 2016/10/16. Download and start Druid. Ingest the dataset into druid using the sql
INSERT INTO "regression_demo"
WITH "ext" AS (SELECT *
FROM TABLE(
  EXTERN(
    '{"type":"local","baseDir":"<folder where dataset is unzipped>","filter":"20160930_203718.csv"}',
    '{"type":"csv","findColumnsFromHeader":true}',
    '[{"name":"Time (s)","type":"double"},{"name":"CO (ppm)","type":"long"},{"name":"Humidity (%r.h.)","type":"double"},{"name":"Temperature (C)","type":"double"},{"name":"Flow rate (mL/min)","type":"double"},{"name":"Heater voltage (V)","type":"double"},{"name":"R1 (MOhm)","type":"double"},{"name":"R2 (MOhm)","type":"double"},{"name":"R3 (MOhm)","type":"double"},{"name":"R4 (MOhm)","type":"double"},{"name":"R5 (MOhm)","type":"double"},{"name":"R6 (MOhm)","type":"double"},{"name":"R7 (MOhm)","type":"double"},{"name":"R8 (MOhm)","type":"double"},{"name":"R9 (MOhm)","type":"double"},{"name":"R10 (MOhm)","type":"double"},{"name":"R11 (MOhm)","type":"double"},{"name":"R12 (MOhm)","type":"double"},{"name":"R13 (MOhm)","type":"double"},{"name":"R14 (MOhm)","type":"double"}]'
  )
))
SELECT
  MILLIS_TO_TIMESTAMP(TIMESTAMP_TO_MILLIS(TIME_PARSE('2016-09-30T20:37:18Z'))+CAST (1000*("Time (s)") as INT)) __time,
  "CO (ppm)",
  "Humidity (%r.h.)",
  "Temperature (C)",
  "Flow rate (mL/min)",
  "Heater voltage (V)",
  "R1 (MOhm)",
  "R2 (MOhm)",
  "R3 (MOhm)",
  "R4 (MOhm)",
  "R5 (MOhm)",
  "R6 (MOhm)",
  "R7 (MOhm)",
  "R8 (MOhm)",
  "R9 (MOhm)",
  "R10 (MOhm)",
  "R11 (MOhm)",
  "R12 (MOhm)",
  "R13 (MOhm)",
  "R14 (MOhm)"
FROM "ext"
PARTITIONED BY HOUR
Since each file has a title with day and time stamp, the time_floor expression for each file will change in the sql above. So ‘2016-09-30T20:37:18Z’ is for 20160930_203718.csv and ‘2016-10-01T23:18:09Z’ is for 20161001_231809.csv and so on. Install and configure Apache Superset.
Exploratory data analytics
Follow this post to link up superset with druid. Create a time series line chart using the regression_demo source in Druid.

add the CO (ppm) and choose sum as aggregation and create a line chart
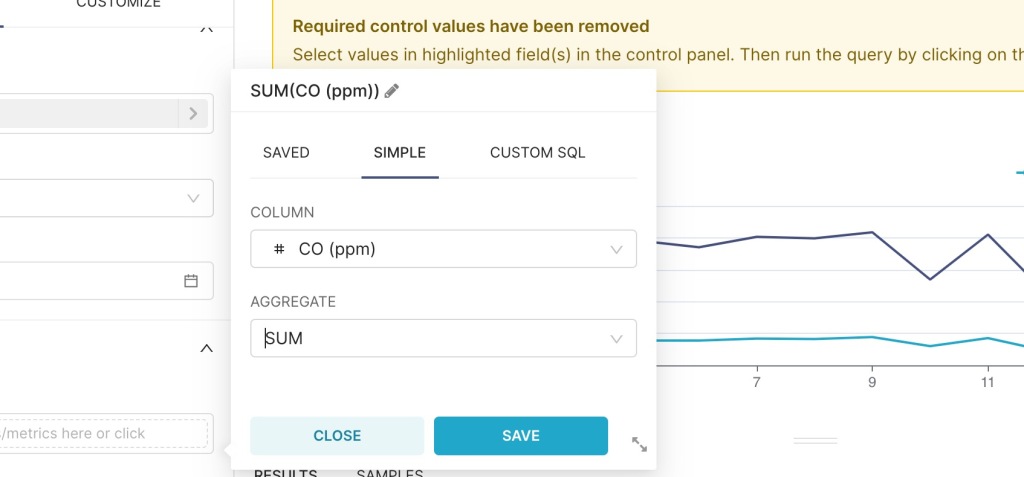
add Humidity (%r.h) to get the below chart
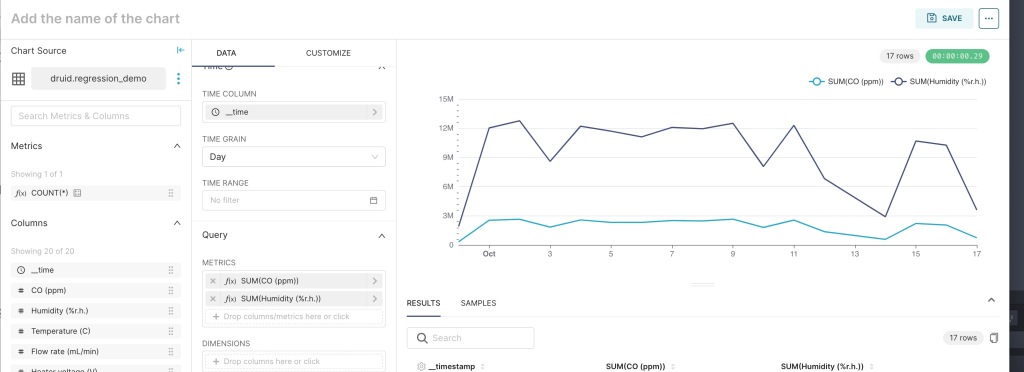
Note that the correlation between humidity and CO is fairly consistent. So humidity would be a good measurement to use in predicting CO. Now add temperature and change the time grain to Hour.
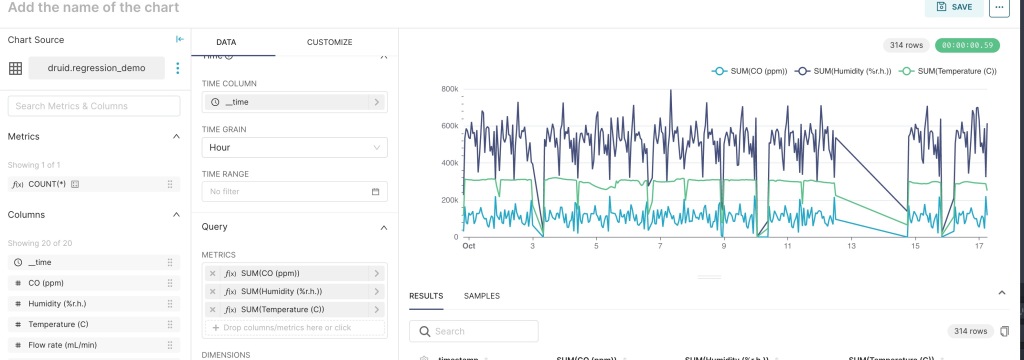
Clearly temperature does not follow the CO concentration very closely with the Hourly grain. So I decided to drop temperature. With Druid it is easy to add or remove metrics and change the Time grain. Using a similar analysis I narrowed down the variables to
sum(“Humidity (%r.h.)”) AS Humidity,
sum(“R1 (MOhm)”) AS R1,
sum(“R3 (MOhm)”) AS R3,
sum(“R4 (MOhm)”) R4,
sum(“R14 (MOhm)”) R14
Training the model
Install Jupyter notebook. Download the notebook for this blog. This notebook uses pydruid to connect from python to Druid and use Sklearn to train a machine learning model (you need to install numpy and pandas along with sklearn and pydruid to make use of this notebook)
Import all the required libraries
from pydruid.client import *
from pydruid.utils.aggregators import *
from pydruid.db import connect
import pandas as pd
import numpy as np
from sklearn.model_selection import train_test_split
from sklearn.metrics import accuracy_score
from sklearn.metrics import classification_report
from sklearn.linear_model import LogisticRegression
from sklearn import *
import random
import html
connect to Druid. Change the port and host to the port and host on which your Druid router is running
conn = connect(
  host='localhost',
  port=9999,
  path='druid/v2/sql',
  scheme='http')

curs = conn.cursor()
get data from Druid and load it into a data frame in python. Note that the below code extracts the selected metrics at an hourly grain from Druid
df = pd.DataFrame(curs.execute("""
    SELECT time_floor(__time,'PT1H') AS t1,
       sum("CO (ppm)") AS CO,
       sum("Humidity (%r.h.)") AS Humidity,
       sum("R1 (MOhm)") AS R1,
       sum("R3 (MOhm)") AS R3,
       sum("R4 (MOhm)") R4,
       sum("R14 (MOhm)") R14
FROM "druid"."regression_demo"
GROUP BY 1
"""))
create feature and label vectors
X = df[['Humidity','R1','R3','R4','R14']]
y = df[['CO']]
create test/train split and train a knn regression model
from sklearn.model_selection import train_test_split
X_train, X_test, y_train, y_test = train_test_split(X, y, test_size=0.33, random_state=42)
from sklearn.neighbors import KNeighborsRegressor
knnr = KNeighborsRegressor(n_neighbors = 50)
knnr.fit(X_train, y_train)
compute the mean square error
print ("The MSE is:",format(np.power(y_test-knnr.predict(X_test),2).mean()))
I started with an hourly grain which gave me a very large error (9.501070e+08) and then reduced the grain to second which resulted in a much smaller error (11.576547).

I further reduced the grain to 1 ms (the time grain of the raw data) and the error reduced to 8.891102. However with 1s grain the time to train the model was lesser than with the 1ms grain.
Conclusion
I trained a regression model using Druid as a source of training data. With Druid I was able to add and remove metrics and look at time series charts to identify metrics that could be used in the model. I was then able to train models using different time granularities to progressively reduce the error. This analysis is useful as we discovered that with 1s granularity the error is in the same ballpark as with 1ms granularity but the model training time is significantly lesser. This dataset had 3,547,481 rows. A production data lake will likely have billions of rows. Also there usually are 10s or 100s of data scientists training different models. Druid’s ability to handle adhoc aggregations under high concurrency enables models to be trained quickly. Bringing large amounts of data into python and aggregating slows down model training.
This post focussed on the ability to do adhoc aggregations in Druid with different metrics and different time granularities. In subsequent posts I will focus on some of the other capabilities
Key links
- Jupyter –Jupyter notebook install
- All things Druid – https://druid.apache.org/
- Superset – https://superset.apache.org/
- demo notebook – https://github.com/vnarayaj/blogcontent/blob/main/regression_demo/druid%20regression.ipynb
- sklearn – https://scikit-learn.org/stable/
- pydruid – https://github.com/druid-io/pydruid
